Key Takeaways
- The sar command is part of the sysstat package and collects performance statistics for various elements of a Linux computer in real-time and historical reports.
- Run “sudo apt install sysstat” in the Terminal to install the sysstat package and sar.
- Sar provides real-time statistics for CPU load, memory paging, swap usage, and more. It can also display historical data for specific time periods, allowing you to analyze past performance issues.
The sar command lets you see performance statistics for different elements of your Linux computer, for both real-time and historical data. We show you how to use this great resource.
What Does The sar Command Do?
The sar command, or System Activity Reporter, is part of the sysstat package. It captures a set of statistical information such as CPU load, memory paging, memory utilization, swap usage, network I/O, and much more. It makes this data accessible to you in real-time snapshots—showing you what’s happening on your computer right nowand in historical reports.
It runs in the background as a daemon, gathering a set of data every ten minutes. The data for the current day is written to a text file. It is converted to a binary file as midnight passes. The files are overwritten each month so they don’t steadily gobble up your hard drive’s capacity.
The sar command lets you interrogate the system and see the statistics. But first, you’ll need to install the sysstat package.
Installing the sysstat Package
Installing sysstat is very straightforward. We use the package manager of your Linux system to install it and then use systemd to enable and start the background daemon.
To install sysstat on Ubuntu we use apt:
sudo apt install sysstat
To install sysstat on Fedora, type:
sudo dnf install sysstat
And to install sysstat on Manjaro, we use pacman:
sudo pacman -S sysstat
With sysstat installed, we need to enable it so that it can run as a daemon—a background process—each time you boot your computer, and we need to start it now so that we can use it right away. We use systemctl, part of the systemd family of utilities, to enable and start daemons.
sudo systemctl enable sysstat
sudo systemctl start sysstat
To see which version of sar you’re using, and to make sure it is responding, you can use the -V (version) option:
sar -V
Real-Time Statistics With sar
You can use sar to see what is happening inside your computer right now. And because a snapshot is just that—the state of play at a certain point in time—and sometimes a trend is more useful, you can ask sar to display several snapshots with a specified number of seconds between them.
CPU Statistics
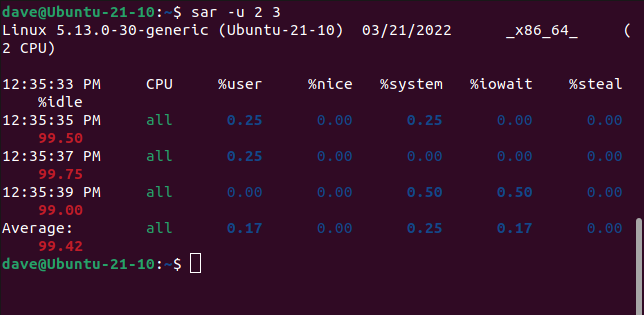
To see three sets of CPU statistics with two seconds between them, we’d use this command, which uses the -u (CPU) option. Note that the interval comes first. So this command reads “show the CPU stats in steps of two seconds, for three sets of data.”
sar -u 2 3
Stretching your terminal window makes the table line up neatly, so it is easier to read.
The header for the first column is the time the command was executed. The values in the column are the time each set of data was collected at. The other columns are:
- CPU: The number of the CPU core, or
ALLfor the average of all cores. - %User: The percentage of time spent running applications at the user level, “in userland.”
- %Nice: The percentage of time spent running applications at the user level, with nice priority.
- %system: The percentage of time spent executing processes at the system level, in the kernel.
- %iowait: The percentage of time when the CPU was idle with a pending disk I/O request.
- %steal: In a virtual machine, this is the percentage of time the virtual CPU was idle because the CPU of the hardware host was servicing a different virtual machine.
- %idle: The percentage of time when the CPU was idle without any pending disk I/O requests.
The final line is the average of the preceding lines.
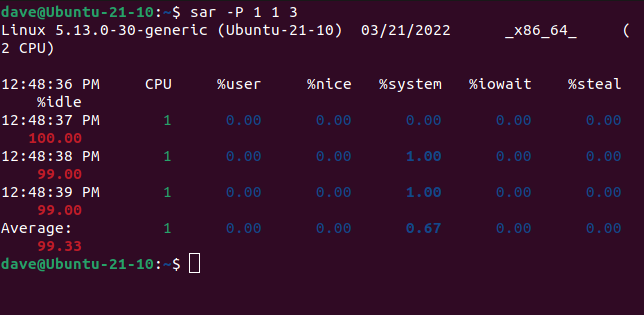
To see the statistics for a specific core, use the -P (per-processor) option. This is followed by the number of a CPU core, or a list or range of core numbers, like 0,1,4 or 4-8.
This command looks at three sets of data with one second between them, for core 1. Remember, cores are numbered from zero.
sar -P 1 1 3
Memory Paging Statistics
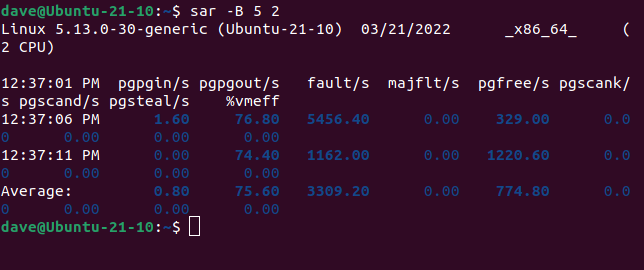
The -B (paging) option causes sar to display statistics related to the paging of memory to the hard drive. We’re going to ask for two sets of information, with five seconds between them.
sar -B 5 2
The columns contain the following information.
- pgpgin/s: Total number of kilobytes the system has paged in (retrieved) from the hard drive per second.
- pgpgout/s: Total number of kilobytes the system has paged out to the hard drive per second.
- fault/s: Number of page faults, both minor and major, made by the system per second.
- majflt/s: Number of major faults the system has made per second, that have required loading a memory page from disk.
- pgfree/s: Number of pages placed on the free list by the system per second.
- pgscank/s: Number of pages scanned by the memory management system
kswapddaemon per second. - pgscand/s: Number of pages scanned directly per second.
- pgsteal/s: Number of pages the system has reclaimed from cache per second.
- %vmeff: Calculated as
pgsteal/pgscan, this is an indication of the efficiency of page reclaims.
I/O Transfer Rates
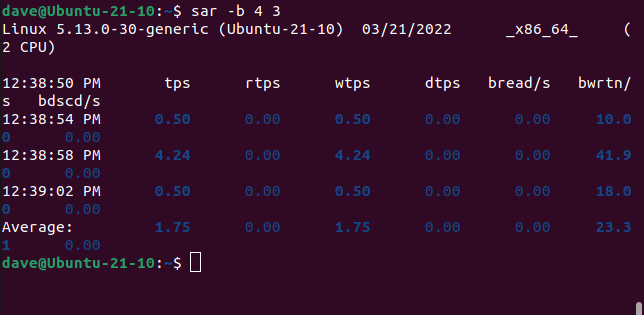
To see the I/O and transfer rate statistics, use the -b (note, lowercase “b”) option. We’re asking for three sets of data with four seconds between them.
sar -b 4 3
This is what the columns hold.
- tps: Total number of transfer requests per second that were made to physical devices. Note that this is a count of requests. They may not all have been successful.
- rtps: Total number of read requests per second issued to physical devices.
- wtps: Total number of write requests per second issued to physical devices.
- dtps: Total number of discard requests per second issued to physical devices.
- bread/s: Total amount of data read from physical devices. The figure is given in blocks of 512 bytes, per second.
- bwrtn/s: Total amount of data written to physical devices in blocks per second.
- bdscd/s: Total amount of data discarded in blocks per second.
There are many more categories of information that you can select to review. They are all used in the same manner. You can also use the -A (all) option to see a complete dump of everything sar can throw at you.
Check out the sar man page for the full list.
Historical Statistics With sar
To review any of the historical data is simply a case of adding the -s (start) and -e (end) options time to any of the usual sar commands. The times are expressed in the 24-hour clock.
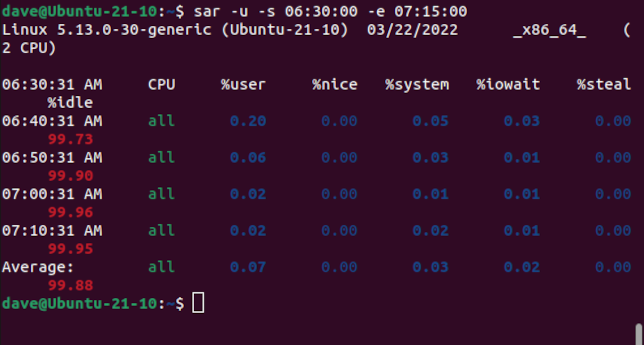
To see what the CPU load was like between 06:30 and 07:15 today, we’ll use this command.
sar -u -s 06:30:00 -e 07:15:00
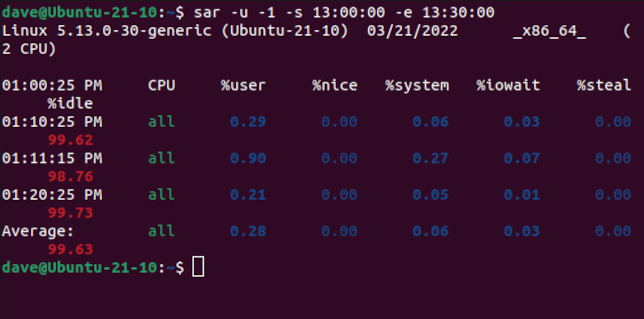
To see what the situation was like on a previous day, use a number as an option flag. The number indicates which day to report on. The -1 option would mean yesterday, the -2 option would mean two days ago, and so on.
Let’s generate a report between 13:00 and 13:00, using yesterday’s data.
sar -u -1 -s 13:00:00 -e 13:30:00
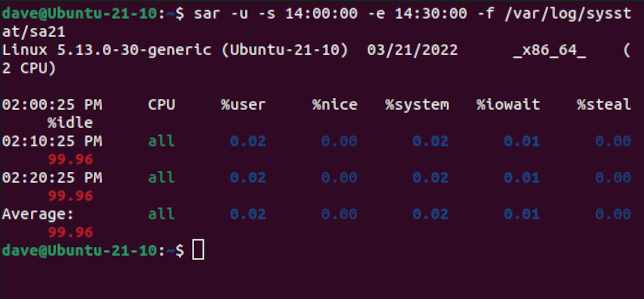
Another way to specify the day you wish to report on is to use the name of that day’s data file on the command line. We do this with the -f (filename) option.
The daily files are called “saXX” where the XX is replaced by the day of the month. They’re created in the log folder of your Linux computer. The sar log folder is probably called “/var/log/sa/” or “/var/log/sysstat/.”
On Ubuntu it is “/var/log/sysstat/” so the format of our command to see the CPU usage between 14:00 and 14:30 for the 21st day of this month would look like this:
sar -u -s 14:00:00 -e 14:30:00 -f /var/log/sysstat/sa21
Information Is Power
And sar certainly gives you enough information to make informed decisions on the performance of your computer.
If you’re in a support role—or you’re the tech support for your friends and family—being able to review historical data is a great way to start digging into an issue that gets reported to you today but actually happened yesterday. Or last week.


